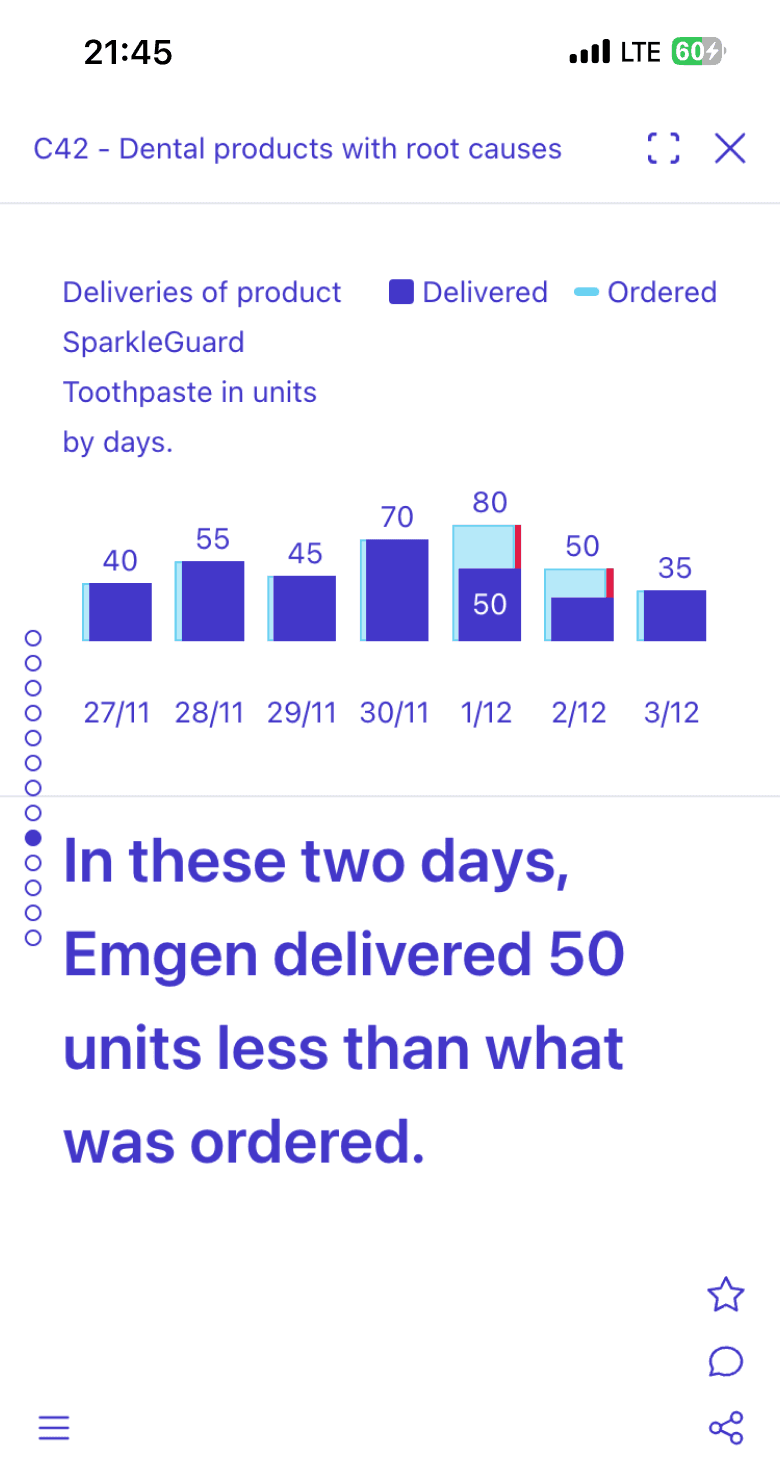
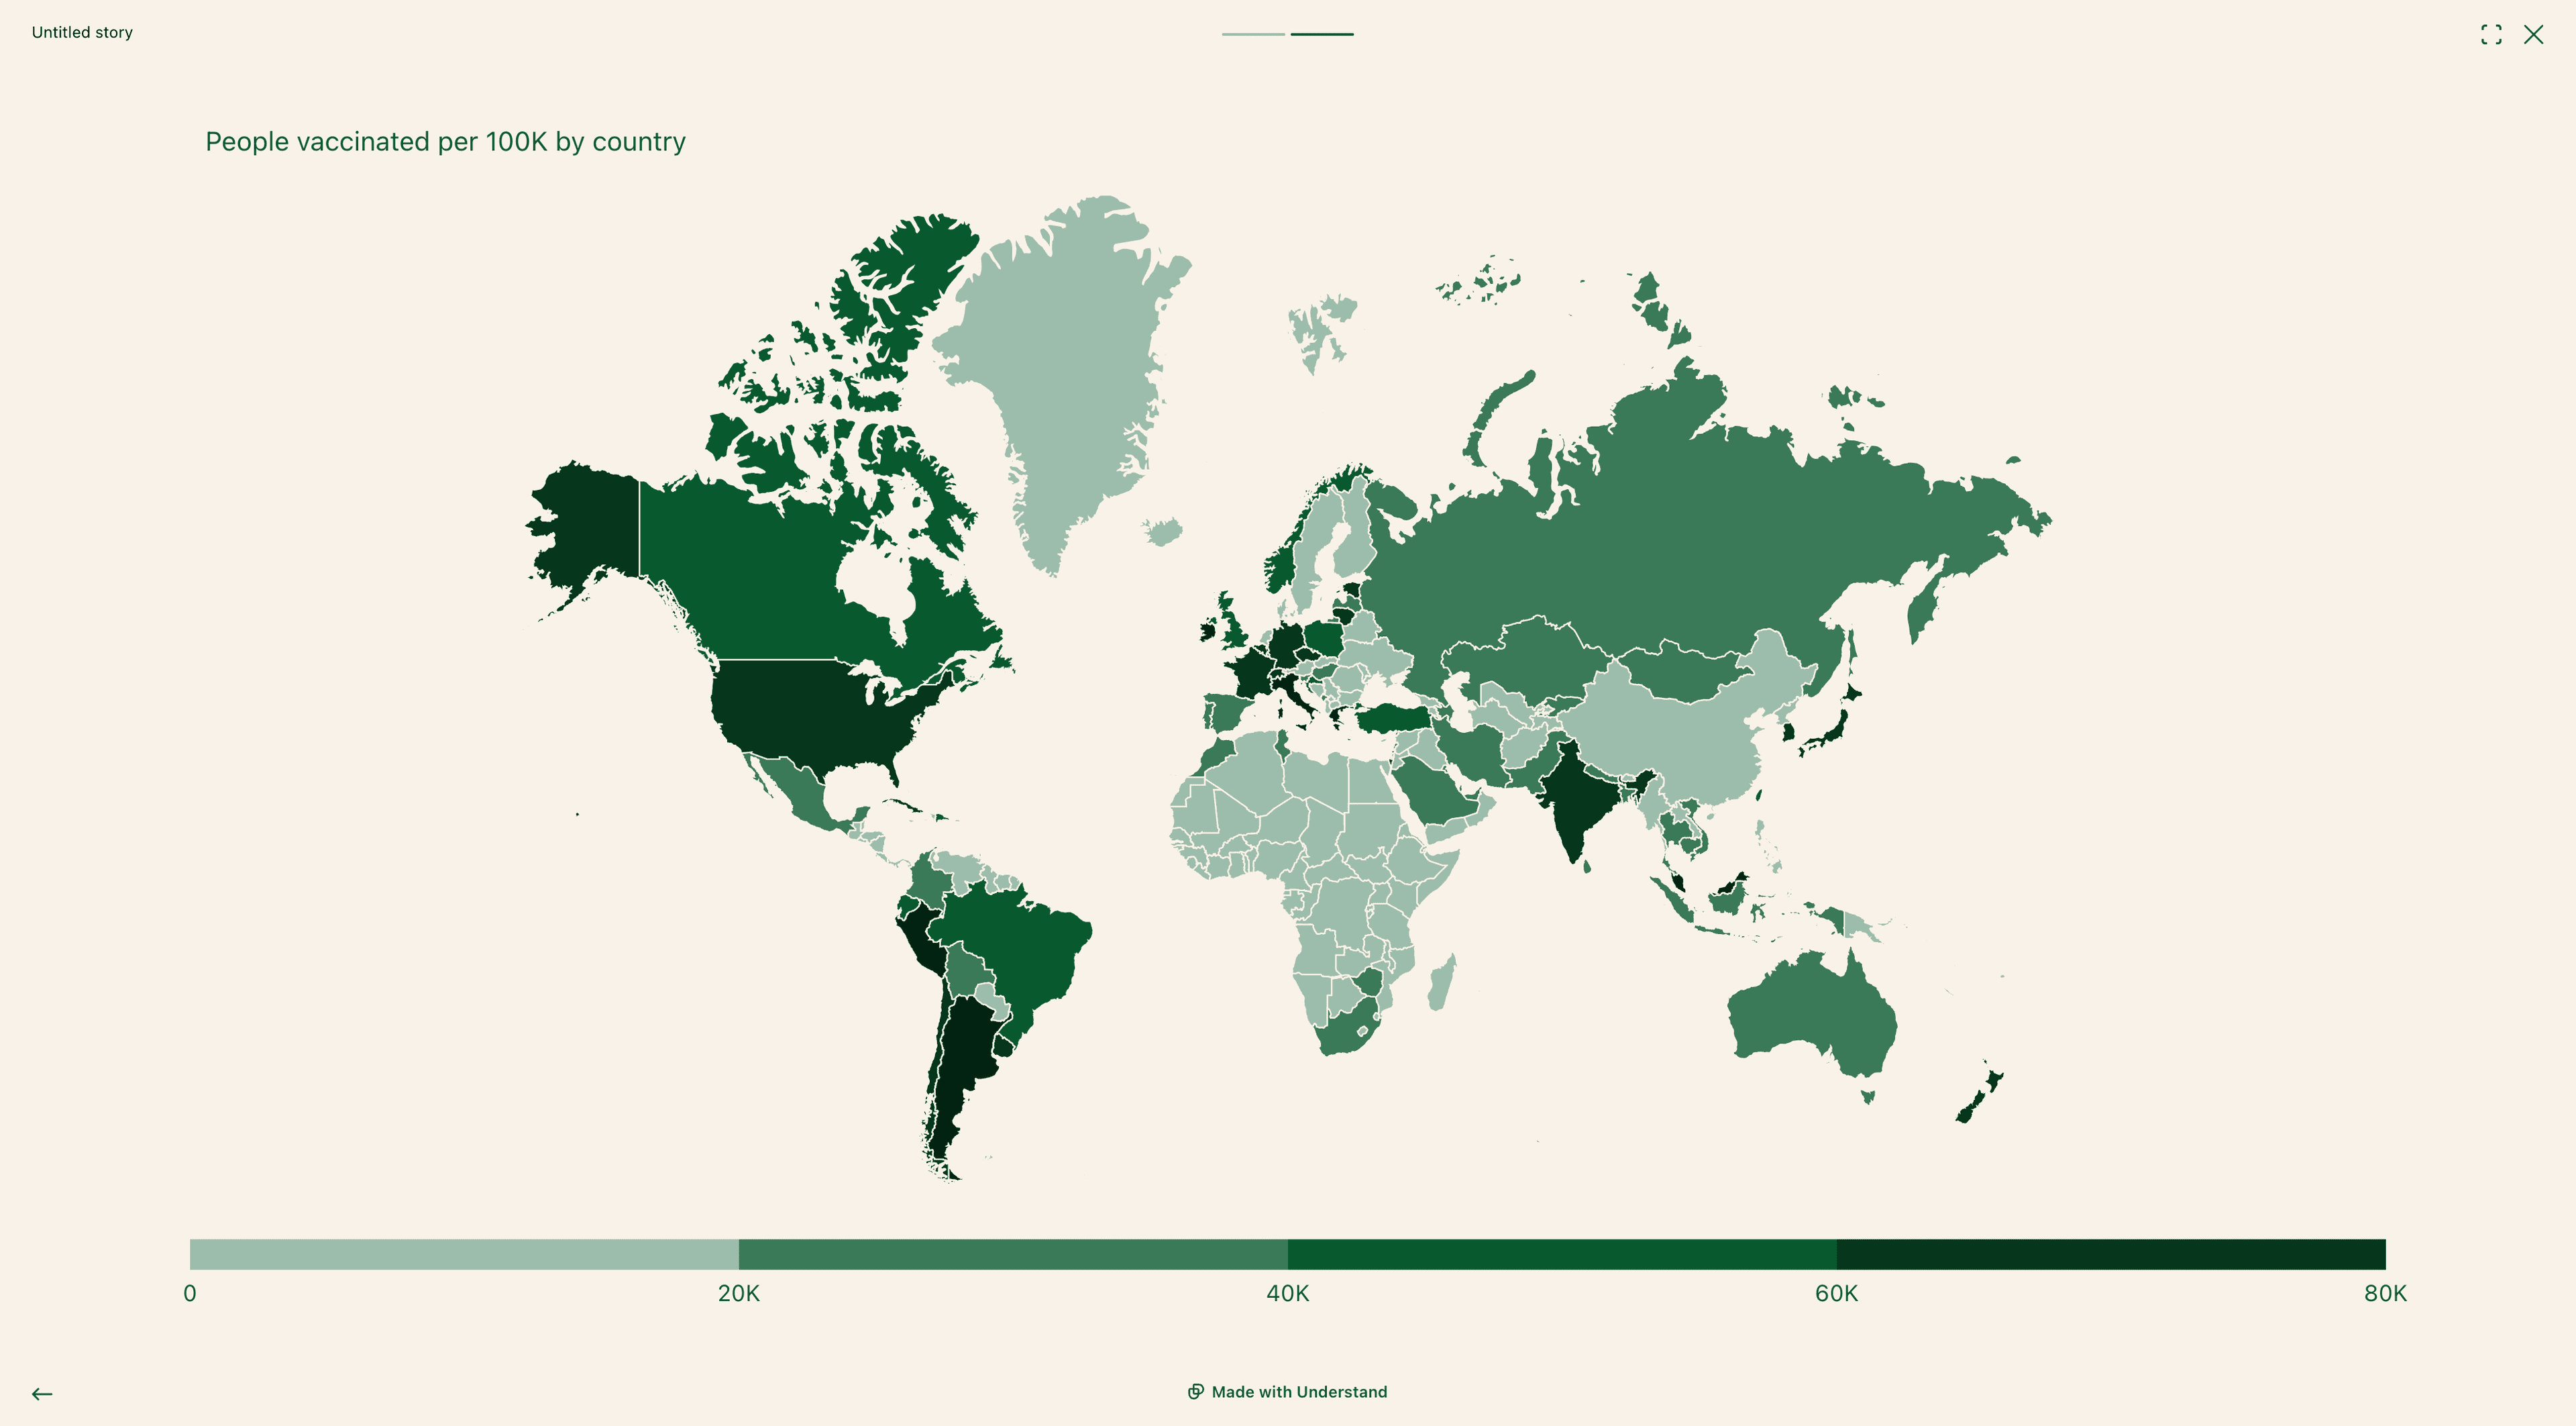
"Dataframes connected to slides are ❤️"
Data visualizations.
Made much better.
Level up from static charts and complex dashboards to data stories.
Delight your users, get more views and let everyone make better decisions.
Sign up for free* No credit card required

Trusted by members of modern data teams.
Data stories are a radically better way to visualize data.
It's like a movie of your data.Share more insights with less noise.
Delight your users.Scrolly-telling is more captivating than static charts.
Market has grown 7% MoM.
We have grown 3% more.
Get more views.Everyone understands data stories quickly and easily.


✅


+2
❤️


👀


👍


Make better decisions.Charts with context are more insigtful than dashboards.
With weekly
promotions.+$12+8%
promotions.+$12+8%
Understand has everything you need to make data stories.
Connect any data.Easily import data from files, Google, SQL databases, OLAP cubes or APIs.


Design powerful stories.Get all the building blocks to design world-class data stories.
Story
Card
Chart
Transition
Layer
Story
Explain in stepsThe story is a series of cards.
New cards appear as you scroll.
This is called scrollytelling, and it makes guiding through data much easier than using a complex dashboard canvas.
New cards appear as you scroll.
This is called scrollytelling, and it makes guiding through data much easier than using a complex dashboard canvas.
Market has grown 7% MoM.
We have grown 3% more.
Analyze and summarize with AI. 🤖Our AI will make data stories dynamic and save you time. Find anomalies.
Alert everyone with their story. 🔔Give the right story to the right people at the right time.

#revenue
#margin
2


and more...
Never go wrong.We researched best practices so you can make perfect data stories.
Effective data storytelling
Internation Business communication standards
The Data Storyteller's Handbook
Data story
Explain dataand inspire actionthrough story
View on mobile.Data stories look great on any device.App screenshot 

Schedule updates.Get new data stories on a regular basis.
Schedule
Daily
12:00am
Story
Margin outliers
Pick your colors.Select or create beautiful themes.
+
Share anywhere.Many ways to share your data stories. PDF
PDF Slack
Slack
Share
 PDF
PDF Slack
SlackPublic
https://app.understandhq.com/s/d8b1cf75-bfa6-46bf-8b14-3bd11ad28d11
Pricing
Annual billing (Save 20%)
StarterFor individuals who want to create and share beautiful data stories.FreeStarter includes:Get started
Single editor
Unlimited stories
Fully-featured story editor
CSV upload and manual data entry
Public sharing
Scrollytelling
GrowthFor teams that want to use stories to make better data-driven decisions.Try 14 days for free
$25per editor/month
Everything in Starter and: Unlimited viewers
Custom themes
Google Sheets connector
PostgreSQL
MySQL
MariaDB
Understand AI (30 cards)
Channels
Email / Slack notifications
More Understand AIUse Understand AI on more cards.
+$15per 30 cards/month
Advanced connectors


+$99per connector/month
APICreate stories at scale using our API.
+$199per month
Enterprise-readyFor organizations with additional integration, collaboration, and security requirements.
OLAP connectors
Custom API
Custom connectors
Custom charts
Private cloud deployment
Single tenant deployment
SSO
Access control
Start creating data stories now.
Do you need special visualization or connector?
Get custom charts & integrations.We can rapidly create unique visualizations and connectors to meet your storytelling needs.

Do you want to have data stories in your product?
Get a white labeling solution.We help you rapidly integrate data stories into your own app.
Use API to create stories.
from understand_sdk import story
story.create(title="My story", cards=[])
story.create(title="My story", cards=[])
Embed stories to your app.
<iframe src="https://app.understandhq.com/s/1" width="640" height="380" />
Apply your own branding.
+ New story
Run under your own domain.
https://understand.acme.com/